Architecture has a purpose, but some buildings are so unusual they are just plain silly. Sure, architects aren’t perfect, but I wonder how they come up with such crazy ideas. Here are some of the weirdest and most unusual buildings on the earth .
Tuesday, June 30, 2009
some buildings are so unusual


Display Data Using Chart,Plot Chart,Free Chart,Plot Data on Free Chart,Use Free Chart,Use Free Chart For Plotting
Plotting your data can serve as a replacement to tabular data, and is also a great way to add practical graphics to your web page or application. There are many ways you can plot data, but here I have included 20 Really Useful Scripts To Plot Charts In Your Sites/Blog Pages which serves as a easy Charting solution. Hope you like it.
JS Charts
JS Charts is a free JavaScript based chart generator that requires little or no coding. With JS Charts drawing charts is a simple and easy task, since you only have to use client-side scripting (i.e. performed by your web browser). No additional plugins or server modules are required. Just include our scripts, prepare your chart data in XML or JavaScript Array and your chart is ready.
Flot

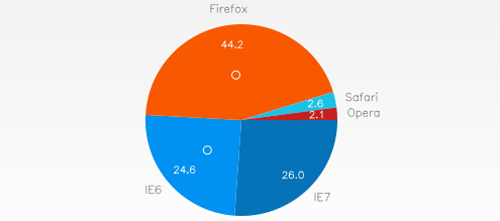
Flot is a pure Javascript plotting library for jQuery. It produces graphical plots of arbitrary datasets on-the-fly client-side. The focus is on simple usage (all settings are optional), attractive looks and interactive features like zooming and mouse tracking. The plugin is known to work with Internet Explorer 6/7/8, Firefox 2.x+, Safari 3.0+, Opera 9.5+ and Konqueror 4.x+.
Style Chart

Style Chart is an innovative technology that allows you to easily embed sophisticated and dynamic charts in your Web site.
FC_RTGraph
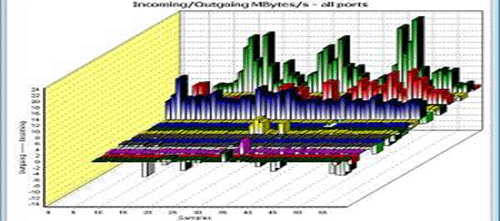
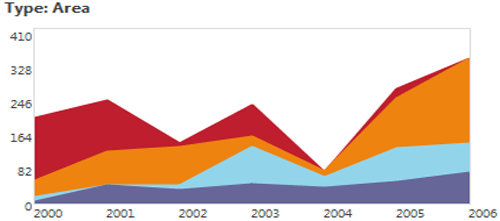
FC_RTGraph is a tool that allows you to collect and graph information from SNMP devices. FC_RTGraph takes an XML formatted config file as input. FC_RTGraph is an excellent tool for real-time monitoring. Collected SNMP data can be graphed in highly customizable 3D graphs (Bar, Area, Line, 3D).
Raphaël
Raphaël is a small JavaScript library that should simplify your work with vector graphics on the web. If you want to create your own specific chart or image crop and rotate widget, for example, you can achieve it simply and easily with this library. Raphaël uses the SVG W3C Recommendation and VML as a base for creating graphics. Raphaël currently supports Firefox 3.0+, Safari 3.0+, Opera 9.5+ and Internet Explorer 6.0+.
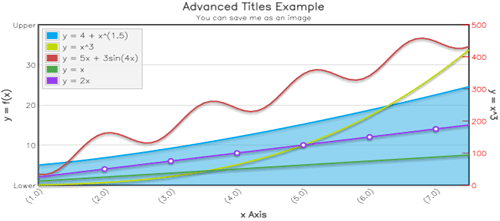
Open Flash Chart 2

Edge cases such as tooltips encourage user interactivity and data exploration and you can re-size the charts. It can manage the missing data. This solution saves the chart as an image form. You can highlight or emphasize one (or many) points.
Google Visualization API
The Google Visualization API lets you access multiple sources of structured data that you can display, choosing from a large selection of visualizations. Google Visualization API enables you to expose your own data, stored on any data-store that is connected to the web, as a Visualization compliant datasource. Thus you can create reports and dashboards as well as analyze and display your data through the wealth of available visualization applications.
Yahoo UI Charts Control
The YUI Charts Control visualizes tabular data on a web page in several possible formats including vertical columns, horizontal bars, lines, and pies. Notable features include support for the DataSource Utility, customizable series and axes, a customizable mouse-over datatip, combination charts, and skinning.
ProtoChart

ProtoChart is an opensource library using Prototype and Canvas to create good looking charts. This library is highly motivated by Flot, Flotr and PlotKit libraries. It supports line, bar, pie, curve, mix, and area charts, multiple data series on same graph, customizable legend, grid, grid border and background. It supports: IE6/7, FF2/3 and Safari and even works on an iPhone.
PlotKit

PlotKit is a Chart and Graph Plotting Library for Javascript. It has support for HTML Canvas and also SVG via Adobe SVG Viewer and native browser support. PlotKit is a complete rewrite of CanvasGraph. It is better structured and supported.

EJSChart supports mouse tracking, mouse events, key tracking and events, zooming. Scrolling, and crosshairs raise interactivity and user experience in web charting to a new level. You can choose multiple chart types: line, area, scatter, pie, bar and function series. Every aspect of the charting display can be configured and customized through well-documented properties and methods.
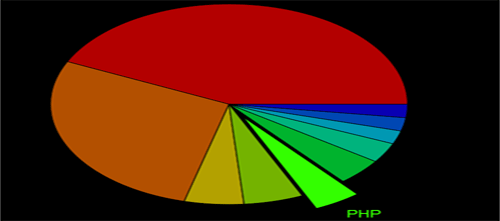
Only Pure Css Data Chart

Data visualization is mostly achieved with flash applications or with help of some programming languages. Are those solutions the only way to present, let’s say simple data chart? How about giving it a try with nothing but good ol’ css? CSSGlobe provides this useful tutorial which explains how to draw simple data Charts using only CSS, without using JavaScript or any backend application.
fgCharting
fgCharting is a nice jQuery plug-in which allows you to plot easly charts. It supports several types of charts (line, filledLine, additiveLine, additiveFilledLine, pie, bar, additiveBar) you can customize how you prefer.
JavaScript Diagram Builder

The JavaScript Diagram Builder supports several types of chart and graph types including bars, dots, lines, and pie charts. The developer has provided a Browser Support tool to help you check if particular objects/methods of the library are supported by your current browser.
Canvas 3D Graph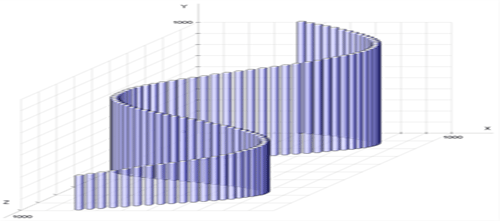
If you need to graph 3-dimensional data, Canvas 3D Graph is worth checking out. Canvas 3D Graph is written with excanvas.js to support Internet Explorer.
Dynamic Drive Pie Graph script

DynamicDrive offers a DHTML/CSS based solution for graphing pie charts. The implementation is straightforward, just include two scripts provided (wz_jsgraphics.js and pie.js), define the values of each segment of your pie chart either inline or in an external JS file, and you’re set!
Flotr Javascript Plotting Library
Flotr, written by Bas Wenneker of Solutoire.com, is a plotting solution inspired by Flot that uses the Prototype JS library and excanvas.js. It supports most modern browsers including Internet Explorer 6, and has many features of Flot including mouse tracking, selection, mouse-tracking features.
Emprise JavaScript Charts

Emprise JavaScript Charts offers a free Personal License for their feature-packed charting/graphing script. Check out their feature comparison table of the different types of licenses to see which license is right for you.
Dynamic Drive Line Graph Script

The Line Graph script is another DHTML solution from DynamicDrive that allows you display line graph data. The procedure for implementation is similar to the Pie Graph script.
JGraph

JGraph - JGraph is the leading Open Source Java Graph Visualization Library. It follows Swing design patterns to provide an API familiar to Swing programmers and functionality that provides a range of features. Graph visualization is a central requirement for applications such as workflow editors, computer and telecommunication networks display, flowcharts, VLSI and CAD, business process modeling, organizational charts, entity-relationship and cause and effect diagrams, and much more.
Make A Profile In Firefox And Manage It,Manage And Create Profile in Firefox
01. Close your Firefox.
02. Now Go To Start --> Run or use Win+R keys and type this:


For Vista/Windows 7

03. This will open Profile Manager for you. Now click on Create Profile... (I have untick Don't ask at startup option, so that you can select which profile to load when you start Firefox)

Click Next and now Choose the Name of your profile(marked as 1). You can optionally choose where to save your profile data, just click on Choose Folder... and choose the location , which is useful if you plan on exporting your data and settings to another computer or setup in the future. And finally click on Finish.


04. You will be taken back to choose the profile you want to work with, as we have previously selected to show it everytime, so whenever you start Firefox, you will be shown below screen, so that you can choose your working profile:

Besides this, you have other options like:

- Rename Profile..., to rename a profile selected.
- Delete Profile..., to delete a selected profile.
- Work offline, to loads the selected profile and starts Firefox without connecting to the Internet. You can view previously viewed web pages and experiment with your profile.
Saturday, June 27, 2009
Michael Jackson died, Michael Jackson photos, Michael Jackson Videos, Michael Jackson Video,Michael Jackson Photo,Mickael Jackson - Smooth criminal (L
Michael Jackson's death , confimed that Michael Jackson has died, Michael Jackson has died, Michael Jackson died, Michael Jackson photos, Michael Jackson Videos, Michael Jackson Video,Michael Jackson Photo,
Mickael Jackson - Smooth criminal (Live),Mickael Jackson Live,Mickael Jackson Live Show
It has now been confimed that Michael Jackson has died following a cardiac arrest.

The 50-year-old singer was not breathing when a 911 call was made at about 12:20 pm PT and despite efforts to revive him, he never recovered.
Initially, a spokesperson for UCLA Medical Center had confirmed that Michael Jackson has been hospitalized, but declined to comment on the specifics of Jackson's medical condition. But within minutes, TMZ.com and several other outlets were reporting that Jackson had died.
Jackson had been living in West Hollywood as he continued to rehearse for a series of 50 old-out concerts that were set to take place in July. The dates for those shows had been pushed back after reports that Jackson might be suffering some sort of medical issue.
Representatives from Jackson had denied those rumors, claiming the delay was due to the singer's desire to give his fans the "perfect concert experience."

Michael is survived by three children: Michael Joseph Jackson, Jr., Paris Michael Katherine Jackson and Prince "Blanket" Michael Jackson II.
Mickael Jackson - Smooth criminal (Live),Mickael Jackson Live,Mickael Jackson Live Show
It has now been confimed that Michael Jackson has died following a cardiac arrest.

The 50-year-old singer was not breathing when a 911 call was made at about 12:20 pm PT and despite efforts to revive him, he never recovered.
Initially, a spokesperson for UCLA Medical Center had confirmed that Michael Jackson has been hospitalized, but declined to comment on the specifics of Jackson's medical condition. But within minutes, TMZ.com and several other outlets were reporting that Jackson had died.
Jackson had been living in West Hollywood as he continued to rehearse for a series of 50 old-out
 concerts that were set to take place in July. The dates for those shows had been pushed back after reports that Jackson might be suffering some sort of medical issue.
Representatives from Jackson had denied those rumors, claiming the delay was due to the singer's desire to give his fans the "perfect concert experience."

Michael is survived by three children: Michael Joseph Jackson, Jr., Paris Michael Katherine Jackson and Prince "Blanket" Michael Jackson II.
Subscribe to:
Posts (Atom)